Multiple Choice
TABLE 13-6
The following Excel tables are obtained when "Score received on an exam (measured in percentage points) " (Y) is regressed on "percentage attendance" (X) for 22 students in a Statistics for Business and Economics course.
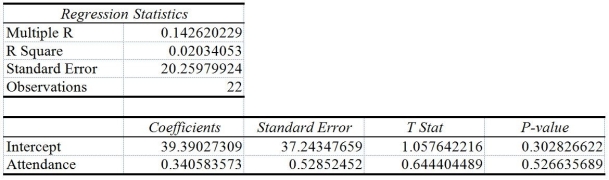
-Referring to Table 13-6, which of the following statements is true?
A) 14.26% of the total variability in score received can be explained by percentage attendance.
B) 14.2% of the total variability in percentage attendance can be explained by score received.
C) 2% of the total variability in score received can be explained by percentage attendance.
D) 2% of the total variability in percentage attendance can be explained by score received.
Correct Answer:

Verified
Correct Answer:
Verified
Q10: TABLE 13-13<br>In this era of tough economic
Q11: TABLE 13-4<br>The managers of a brokerage firm
Q12: TABLE 13-4<br>The managers of a brokerage firm
Q13: TABLE 13-4<br>The managers of a brokerage firm
Q14: TABLE 13-12<br>The manager of the purchasing department
Q16: The sample correlation coefficient between X and
Q17: TABLE 13-10<br>The management of a chain electronic
Q18: TABLE 13-3<br>The director of cooperative education at
Q19: TABLE 13-11<br>A computer software developer would like
Q20: TABLE 13-11<br>A computer software developer would like