Multiple Choice
TABLE 13-12
The manager of the purchasing department of a large saving and loan organization would like to develop a model to predict the amount of time (measured in hours) it takes to record a loan application. Data are collected from a sample of 30 days, and the number of applications recorded and completion time in hours is recorded. Below is the regression output:
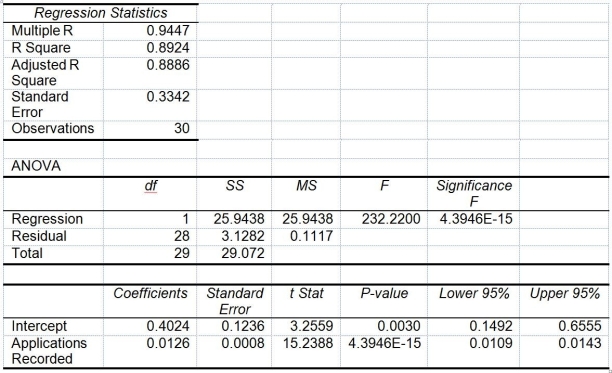
Note: 4.3946E-15 is 4.3946 ×

-Referring to Table 13-12, the p-value of the measured t test statistic to test whether the number of loan applications recorded affects the amount of time is
A) (4.3946E-15) /2.
B) 4.3946E-15.
C) (0.0030) /2.
D) 0.0030.
Correct Answer:

Verified
Correct Answer:
Verified
Q202: The confidence interval for the mean of
Q203: TABLE 13-3<br>The director of cooperative education at
Q204: TABLE 13-3<br>The director of cooperative education at
Q205: TABLE 13-10<br>The management of a chain electronic
Q206: TABLE 13-3<br>The director of cooperative education at
Q207: TABLE 13-13<br>In this era of tough economic
Q208: TABLE 13-10<br>The management of a chain electronic
Q210: TABLE 13-13<br>In this era of tough economic
Q211: TABLE 13-5<br>The managing partner of an advertising
Q212: TABLE 13-4<br>The managers of a brokerage firm