Multiple Choice
TABLE 13-12
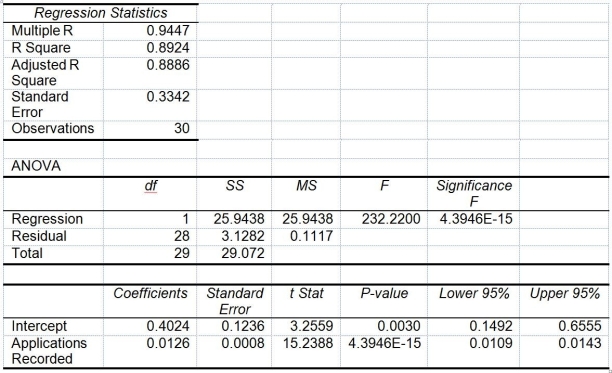
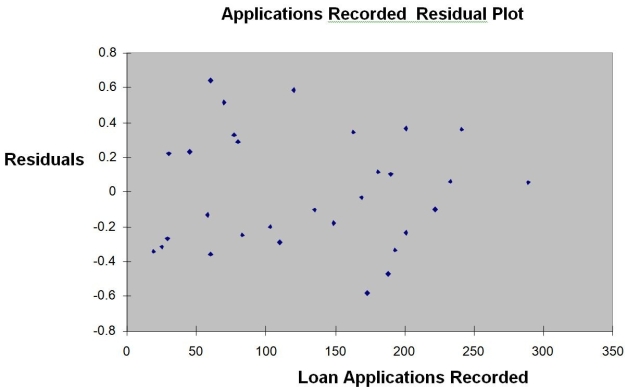
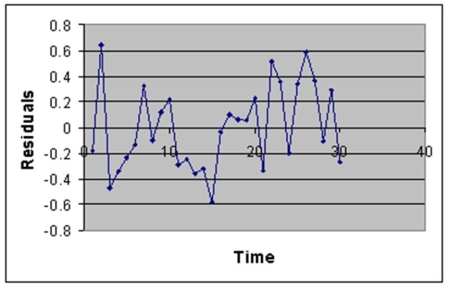
The manager of the purchasing department of a large saving and loan organization would like to develop a model to predict the amount of time (measured in hours) it takes to record a loan application. Data are collected from a sample of 30 days, and the number of applications recorded and completion time in hours is recorded. Below is the regression output:

Note: 4.3946E-15 is 4.3946 ×


-Referring to Table 13-12, to test the claim that the mean amount of time depends positively on the number of loan applications recorded against the null hypothesis that the mean amount of time does not depend linearly on the number of invoices processed, the p-value of the test statistic is
A) (4.3946E-15) /2.
B) 4.3946E-15.
C) (4.3946E-15) *2.
D) 0.0030.
Correct Answer:

Verified
Correct Answer:
Verified
Q26: If the correlation coefficient (r)= 1.00,then<br>A)all the
Q51: The strength of the linear relationship between
Q158: TABLE 13-10<br>The management of a chain electronic
Q159: TABLE 13-4<br>The managers of a brokerage firm
Q161: The sample correlation coefficient between X and
Q164: TABLE 13-8<br>It is believed that GPA (grade
Q165: TABLE 13-4<br>The managers of a brokerage firm
Q166: TABLE 13-10<br>The management of a chain electronic
Q167: TABLE 13-7<br>An investment specialist claims that if
Q168: TABLE 13-13<br>In this era of tough economic