Multiple Choice
TABLE 14-3
An economist is interested to see how consumption for an economy (in $ billions) is influenced by gross domestic product ($ billions) and aggregate price (consumer price index) . The Microsoft Excel output of this regression is partially reproduced below. 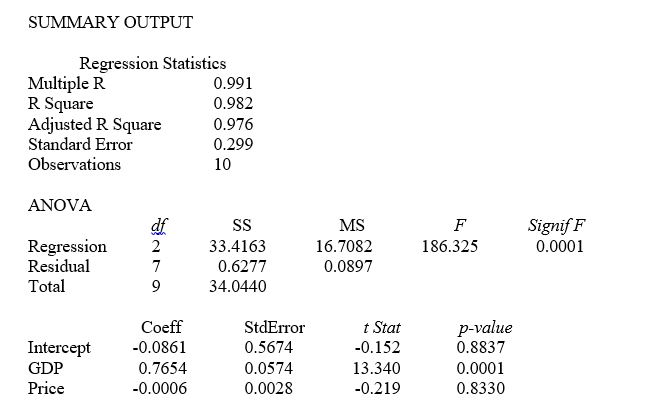
-Referring to Table 14-3, when the economist used a simple linear regression model with consumption as the dependent variable and GDP as the independent variable, he obtained an r² value of 0.971. What additional percentage of the total variation of consumption has been explained by including aggregate prices in the multiple regression?
A) 98.2
B) 11.1
C) 2.8
D) 1.1
Correct Answer:

Verified
Correct Answer:
Verified
Q24: If a categorical independent variable contains 4
Q225: TABLE 14-16<br>What are the factors that determine
Q226: TABLE 14-17<br> <img src="https://d2lvgg3v3hfg70.cloudfront.net/TB1602/.jpg" alt="TABLE 14-17
Q228: TABLE 14-15<br>The superintendent of a school district
Q229: TABLE 14-17<br> <img src="https://d2lvgg3v3hfg70.cloudfront.net/TB1602/.jpg" alt="TABLE 14-17
Q231: TABLE 14-3<br>An economist is interested to see
Q232: TABLE 14-13<br>An econometrician is interested in evaluating
Q233: TABLE 14-18<br>A logistic regression model was estimated
Q234: TABLE 14-9<br>You decide to predict gasoline prices
Q235: TABLE 14-15<br>The superintendent of a school district