Multiple Choice
TABLE 14-4
A real estate builder wishes to determine how house size (House) is influenced by family income (Income) , family size (Size) , and education of the head of household (School) . House size is measured in hundreds of square feet, income is measured in thousands of dollars, and education is in years. The builder randomly selected 50 families and ran the multiple regression. Microsoft Excel output is provided below: 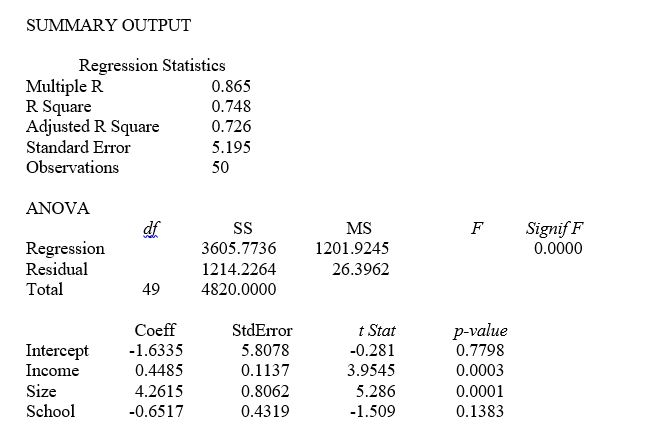
-Referring to Table 14-4, what fraction of the variability in house size is explained by income, size of family, and education?
A) 27.0%
B) 33.4%
C) 74.8%
D) 86.5%
Correct Answer:

Verified
Correct Answer:
Verified
Q28: You have just computed a regression model
Q159: TABLE 14-15<br>The superintendent of a school district
Q160: TABLE 14-17<br> <img src="https://d2lvgg3v3hfg70.cloudfront.net/TB1602/.jpg" alt="TABLE 14-17
Q161: TABLE 14-15<br>The superintendent of a school district
Q162: TABLE 14-11<br>A weight-loss clinic wants to use
Q165: TABLE 14-7<br>The department head of the accounting
Q166: TABLE 14-19<br>The marketing manager for a nationally
Q167: TABLE 14-17<br> <img src="https://d2lvgg3v3hfg70.cloudfront.net/TB1602/.jpg" alt="TABLE 14-17
Q168: TABLE 14-17<br> <img src="https://d2lvgg3v3hfg70.cloudfront.net/TB1602/.jpg" alt="TABLE 14-17
Q169: TABLE 14-13<br>An econometrician is interested in evaluating