True/False
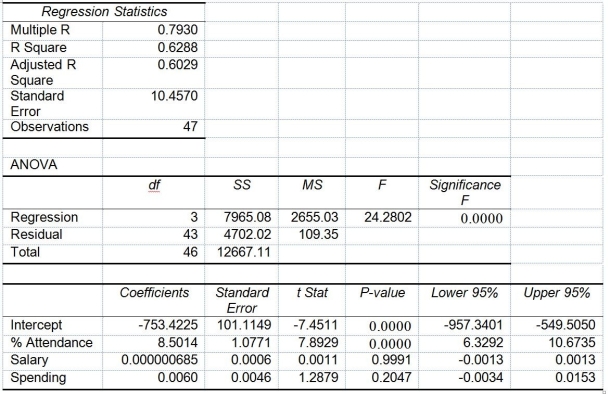
TABLE 14-15
The superintendent of a school district wanted to predict the percentage of students passing a sixth-grade proficiency test. She obtained the data on percentage of students passing the proficiency test (% Passing), daily mean of the percentage of students attending class (% Attendance), mean teacher salary in dollars (Salaries), and instructional spending per pupil in dollars (Spending) of 47 schools in the state.
Following is the multiple regression output with Y = % Passing as the dependent variable, X₁ = % Attendance, X₂= Salaries and X₃= Spending:

-Referring to Table 14-15, the null hypothesis should be rejected at a 5% level of significance when testing whether daily mean of the percentage of students attending class has any effect on percentage of students passing the proficiency test, taking into account the effect of all the other independent variables.
Correct Answer:

Verified
Correct Answer:
Verified
Q125: TABLE 14-16<br>What are the factors that determine
Q126: TABLE 14-19<br>The marketing manager for a nationally
Q127: TABLE 14-14<br>An automotive engineer would like to
Q128: TABLE 14-16<br>What are the factors that determine
Q129: TABLE 14-3<br>An economist is interested to see
Q131: TABLE 14-3<br>An economist is interested to see
Q132: TABLE 14-7<br>The department head of the accounting
Q133: TABLE 14-17<br> <img src="https://d2lvgg3v3hfg70.cloudfront.net/TB1602/.jpg" alt="TABLE 14-17
Q134: TABLE 14-5<br>A microeconomist wants to determine how
Q135: TABLE 14-17<br> <img src="https://d2lvgg3v3hfg70.cloudfront.net/TB1602/.jpg" alt="TABLE 14-17