Multiple Choice
TABLE 15-1
A certain type of rare gem serves as a status symbol for many of its owners. In theory, for low prices, the demand increases and it decreases as the price of the gem increases. However, experts hypothesize that when the gem is valued at very high prices, the demand increases with price due to the status owners believe they gain in obtaining the gem. Thus, the model proposed to best explain the demand for the gem by its price is the quadratic model:
Y = β₀ + β₁X + β₁X² + ε
where Y = demand (in thousands) and X = retail price per carat.
This model was fit to data collected for a sample of 12 rare gems of this type. A portion of the computer analysis obtained from Microsoft Excel is shown below: 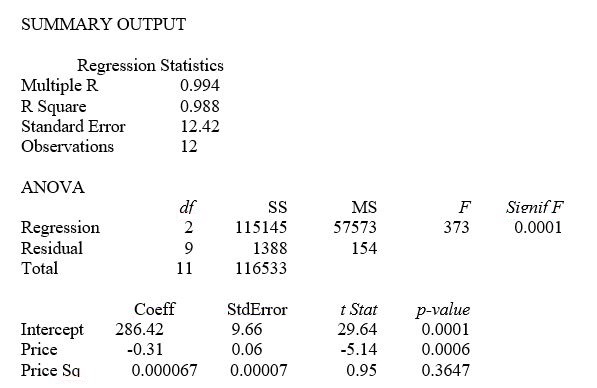
-Referring to Table 15-1, what is the p-value associated with the test statistic for testing whether there is an upward curvature in the response curve relating the demand (Y) and the price (X) ?
A) 0.0001
B) 0.0006
C) 0.3647
D) None of the above.
Correct Answer:

Verified
Correct Answer:
Verified
Q21: Collinearity is present if the dependent variable
Q46: Using the best-subsets approach to model building,
Q46: The logarithm transformation can be used<br>A)to overcome
Q48: TABLE 15-3<br>A chemist employed by a pharmaceutical
Q49: Using the Cp statistic in model building,
Q51: TABLE 15-1<br>A certain type of rare gem
Q52: TABLE 15-5<br>What are the factors that determine
Q53: A high value of R² significantly above
Q55: TABLE 15-2<br> <img src="https://d2lvgg3v3hfg70.cloudfront.net/TB1602/.jpg" alt="TABLE 15-2
Q60: The parameter estimates are biased when collinearity