True/False
TABLE 15-4

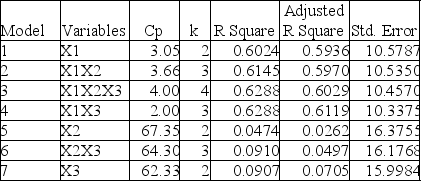
The output from the best-subset regressions is given below:

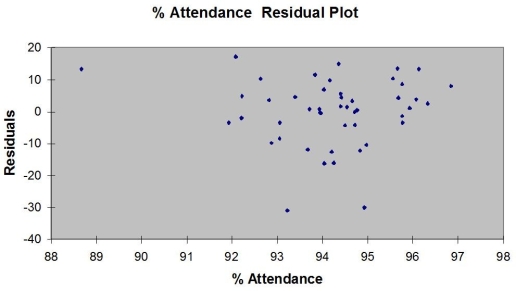
Following is the residual plot for % Attendance:

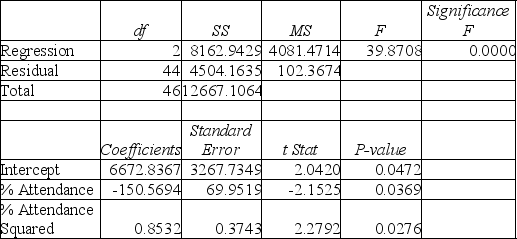
Following is the output of several multiple regression models:
Model (I):

Model (II):

Model (III):

-Referring to Table 15-4, there is reason to suspect collinearity between some pairs of predictors.
Correct Answer:

Verified
Correct Answer:
Verified
Q27: TABLE 15-6<br>Given below are results from the
Q28: The Variance Inflationary Factor (VIF)measures the<br>A)correlation of
Q29: TABLE 15-6<br>Given below are results from the
Q30: TABLE 15-6<br>Given below are results from the
Q34: TABLE 15-3<br>A chemist employed by a pharmaceutical
Q35: TABLE 15-5<br>What are the factors that determine
Q63: Collinearity will result in excessively low standard
Q86: TABLE 15-6<br>Given below are results from the
Q88: TABLE 15-6<br>Given below are results from the
Q88: TABLE 15-6<br>Given below are results from the