Solved

TABLE 15-4 The Output from the Best-Subset Regressions Is Given Below

Question 65

Multiple Choice

TABLE 15-4
TABLE 15-4     The output from the best-subset regressions is given below:     Following is the residual plot for % Attendance:     Following is the output of several multiple regression models: Model (I) :     Model (II) :     Model (III) :    -Referring to Table 15-4, the  best  model using a 5% level of significance among those chosen by the Cp statistic is A)  X₁,X₃. B)  X₁,X₂,X₃. C)  Either of the above D)  None of the above
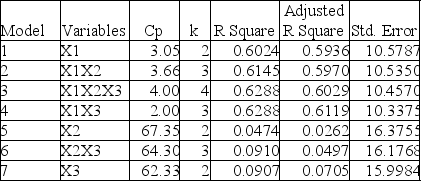
The output from the best-subset regressions is given below:
TABLE 15-4     The output from the best-subset regressions is given below:     Following is the residual plot for % Attendance:     Following is the output of several multiple regression models: Model (I) :     Model (II) :     Model (III) :    -Referring to Table 15-4, the  best  model using a 5% level of significance among those chosen by the Cp statistic is A)  X₁,X₃. B)  X₁,X₂,X₃. C)  Either of the above D)  None of the above
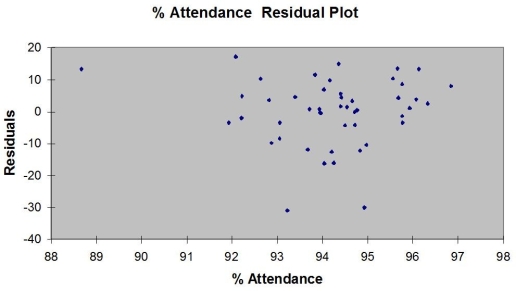
Following is the residual plot for % Attendance:
TABLE 15-4     The output from the best-subset regressions is given below:     Following is the residual plot for % Attendance:     Following is the output of several multiple regression models: Model (I) :     Model (II) :     Model (III) :    -Referring to Table 15-4, the  best  model using a 5% level of significance among those chosen by the Cp statistic is A)  X₁,X₃. B)  X₁,X₂,X₃. C)  Either of the above D)  None of the above
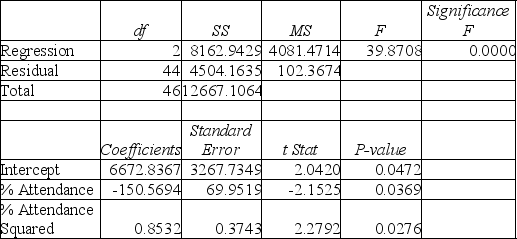
Following is the output of several multiple regression models:
Model (I) :
TABLE 15-4     The output from the best-subset regressions is given below:     Following is the residual plot for % Attendance:     Following is the output of several multiple regression models: Model (I) :     Model (II) :     Model (III) :    -Referring to Table 15-4, the  best  model using a 5% level of significance among those chosen by the Cp statistic is A)  X₁,X₃. B)  X₁,X₂,X₃. C)  Either of the above D)  None of the above
Model (II) :
TABLE 15-4     The output from the best-subset regressions is given below:     Following is the residual plot for % Attendance:     Following is the output of several multiple regression models: Model (I) :     Model (II) :     Model (III) :    -Referring to Table 15-4, the  best  model using a 5% level of significance among those chosen by the Cp statistic is A)  X₁,X₃. B)  X₁,X₂,X₃. C)  Either of the above D)  None of the above
Model (III) :
TABLE 15-4     The output from the best-subset regressions is given below:     Following is the residual plot for % Attendance:     Following is the output of several multiple regression models: Model (I) :     Model (II) :     Model (III) :    -Referring to Table 15-4, the  best  model using a 5% level of significance among those chosen by the Cp statistic is A)  X₁,X₃. B)  X₁,X₂,X₃. C)  Either of the above D)  None of the above
-Referring to Table 15-4, the "best" model using a 5% level of significance among those chosen by the Cp statistic is


A) X₁,X₃.
B) X₁,X₂,X₃.
C) Either of the above
D) None of the above

Correct Answer:

verifed

Verified

Unlock this answer now
Get Access to more Verified Answers free of charge

Related Questions