Multiple Choice
TABLE 15-4

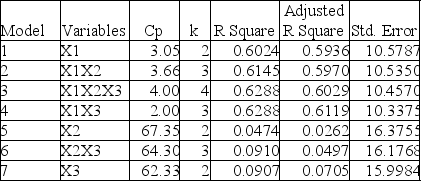
The output from the best-subset regressions is given below:

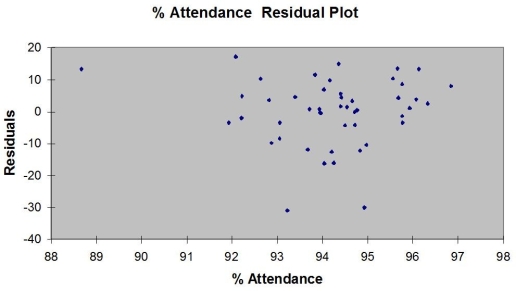
Following is the residual plot for % Attendance:

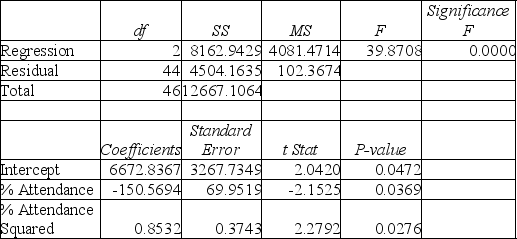
Following is the output of several multiple regression models:
Model (I) :

Model (II) :

Model (III) :

-Referring to Table 15-4, the better model using a 5% level of significance derived from the "best" model above is
A) X₁.
B) X₃.
C) X₁,X₃.
D) X₁,X₂,X₃.
Correct Answer:

Verified
Correct Answer:
Verified
Q13: A regression diagnostic tool used to study
Q20: A regression diagnostic tool used to study
Q54: A microeconomist wants to determine how corporate
Q74: TABLE 15-5<br>What are the factors that determine
Q77: TABLE 15-6<br>Given below are results from the
Q78: TABLE 15-6<br>Given below are results from the
Q80: TABLE 15-6<br>Given below are results from the
Q82: TABLE 15-3<br>A chemist employed by a pharmaceutical
Q83: TABLE 15-6<br>Given below are results from the
Q84: TABLE 15-2<br> <img src="https://d2lvgg3v3hfg70.cloudfront.net/TB1602/.jpg" alt="TABLE 15-2