Essay
TABLE 16-2
The monthly advertising expenditures of a department store chain (in $1,000,000s) were collected over the last decade. The last 14 months of this time series follows: 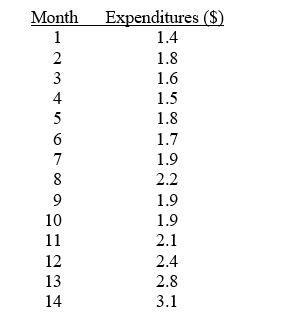
-Referring to Table 16-2, set up a scatter plot (i.e., time-series plot) with months on the horizontal X-axis.
Correct Answer:

Verified
Correct Answer:
Verified
Q15: If a time series does not exhibit
Q36: Which of the following methods should not
Q141: TABLE 16-5<br>The number of passengers arriving at
Q142: TABLE 16-13<br>Given below is the monthly time-series
Q144: TABLE 16-13<br>Given below is the monthly time-series
Q147: A model that can be used to
Q147: TABLE 16-4<br>The number of cases of merlot
Q148: TABLE 16-4<br>The number of cases of merlot
Q149: TABLE 16-13<br>Given below is the monthly time-series
Q150: TABLE 16-8<br>The manager of a marketing consulting