Solved

TABLE 16-13 Given Below Is the Monthly Time-Series Data for U.S. Retail

Question 14

True/False

TABLE 16-13
Given below is the monthly time-series data for U.S. retail sales of building materials over a specific year.
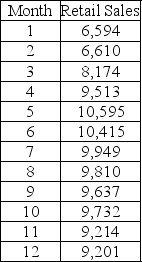
TABLE 16-13 Given below is the monthly time-series data for U.S. retail sales of building materials over a specific year.     The results of the linear trend, quadratic trend, exponential trend, first-order autoregressive, second-order autoregressive and third-order autoregressive model are presented below in which the coded month for the first month is 0:                -Referring to Table 16-13, you can reject the null hypothesis for testing the appropriateness of the second-order autoregressive model at the 5% level of significance.
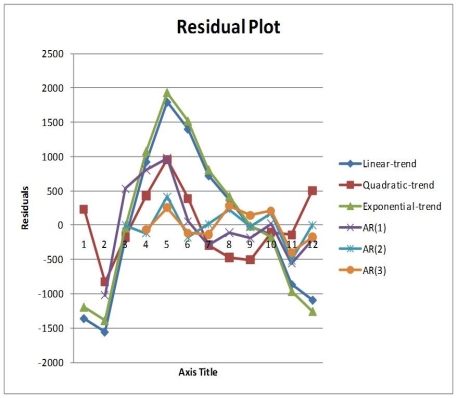
The results of the linear trend, quadratic trend, exponential trend, first-order autoregressive, second-order autoregressive and third-order autoregressive model are presented below in which the coded month for the first month is 0:
TABLE 16-13 Given below is the monthly time-series data for U.S. retail sales of building materials over a specific year.     The results of the linear trend, quadratic trend, exponential trend, first-order autoregressive, second-order autoregressive and third-order autoregressive model are presented below in which the coded month for the first month is 0:                -Referring to Table 16-13, you can reject the null hypothesis for testing the appropriateness of the second-order autoregressive model at the 5% level of significance.
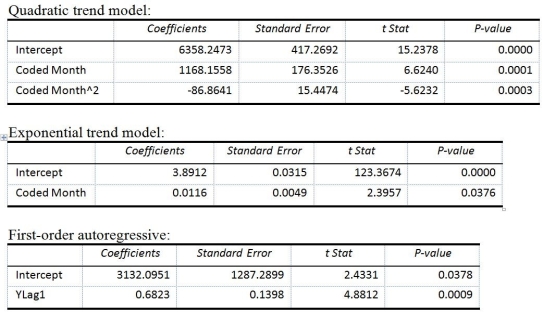
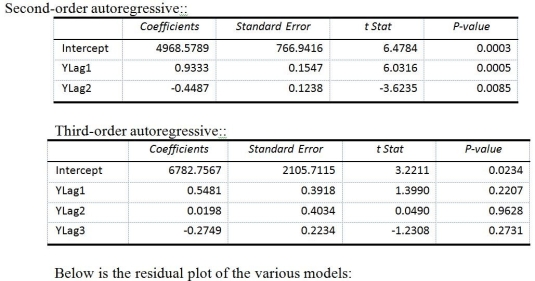
-Referring to Table 16-13, you can reject the null hypothesis for testing the appropriateness of the second-order autoregressive model at the 5% level of significance.

Correct Answer:

verifed

Verified

Unlock this answer now
Get Access to more Verified Answers free of charge

Related Questions