Multiple Choice
TABLE 17-3
A quality control analyst for a light bulb manufacturer is concerned that the time it takes to produce a batch of light bulbs is too erratic. Accordingly, the analyst randomly surveys 10 production periods each day for 14 days and records the sample mean and range for each day.
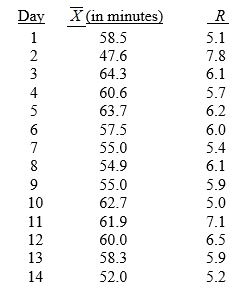
-Referring to Table 17-3, suppose the analyst constructs an R chart to see if the variability in production times is in-control. What is the center line of this R chart?
A) 4.8
B) 6.0
C) 6.9
D) 7.1
Correct Answer:

Verified
Correct Answer:
Verified
Q36: The cause of variation that can be
Q51: TABLE 17-7<br>A supplier of silicone sheets for
Q52: TABLE 17-10<br>Below is the number of defective
Q54: Referring to Table 17-3, suppose the analyst
Q55: The R chart is a control chart
Q60: TABLE 17-1<br>A local newspaper has 10 delivery
Q61: The Cp index measures the potential of
Q73: Common causes of variation represent variation due
Q139: Variation due to the inherent variability in
Q147: Changes in the system to reduce common