Multiple Choice
TABLE 17-4
A factory supervisor is concerned that the time it takes workers to complete an important production task (measured in seconds) is too erratic and adversely affects expected profits. The supervisor proceeds by randomly sampling 5 individuals per hour for a period of 10 hours. The sample mean and range for each hour are listed below.
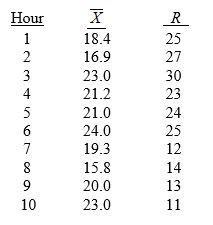
She also decides that lower and upper specification limit for the critical-to-quality variable should be 10 and 30 seconds, respectively.
-Referring to Table 17-4, suppose the supervisor constructs an R chart to see if the variability in collection times is in-control. This R chart is characterized by which of the following?
A) Decreasing trend
B) Increasing trend
C) In-control
D) Individual outliers
Correct Answer:

Verified
Correct Answer:
Verified
Q27: A process is said to be out
Q67: TABLE 17-8<br>Recently, a university switched to a
Q69: Referring to Table 17-4, suppose the supervisor
Q70: Referring to Table 17-4, what is the
Q71: The Shewhart-Deming cycle plays an important role
Q74: Referring to Table 17-4, suppose the supervisor
Q75: Referring to Table 17-7, what is the
Q76: TABLE 17-8<br>Recently, a university switched to a
Q135: The purpose of a control chart is
Q156: The control limits are based on the