Essay
TABLE 17-5
A manufacturer of computer disks took samples of 240 disks on 15 consecutive days. The number of disks with bad sectors was determined for each of these samples. The results are in the table that follows. 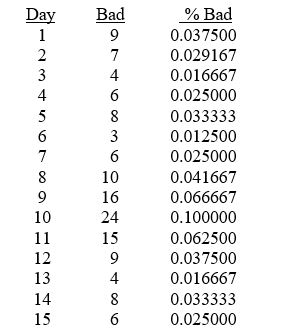
-Referring to Table 17-5, construct a p control chart for these data.
Correct Answer:

Verified
Proportion...View Answer
Unlock this answer now
Get Access to more Verified Answers free of charge
Correct Answer:
Verified
View Answer
Unlock this answer now
Get Access to more Verified Answers free of charge
Q7: CPL >1 implies that the process mean
Q15: TABLE 17-2<br>A political pollster randomly selects a
Q16: TABLE 17-7<br>A supplier of silicone sheets for
Q17: TABLE 17-8<br>Recently, a university switched to a
Q18: Referring to Table 17-3, suppose the analyst
Q19: A process capability is estimated by the
Q21: Which of the following best measures the
Q22: TABLE 17-10<br>Below is the number of defective
Q24: TABLE 17-5<br>A manufacturer of computer disks took
Q25: TABLE 17-2<br>A political pollster randomly selects a