Multiple Choice
(Graph: Consumption) Based on the information provided in the graph, when income equals $1,000, the average propensity to save equals 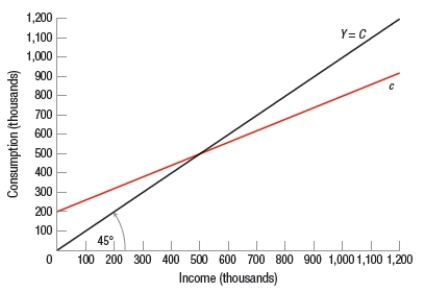
A) 0.2.
B) 0.4.
C) 0.5.
D) 0.6.
Correct Answer:

Verified
Correct Answer:
Verified
Related Questions
Q202: If $1,000 of additional spending occurs and
Q203: According to Keynesian analysis, if households intend
Q204: If the marginal propensity to consume is
Q205: If the marginal propensity to consume is
Q206: (Table) The following table shows data on
Q208: The balanced budget multiplier changes according to
Q209: The multiplier for imports is larger than
Q210: If consumption rises from $500 billion to
Q211: Which statement(s) is/are TRUE regarding the paradox
Q212: (Table: Keynesian Equilibrium Analysis with Taxes and