Multiple Choice
(Figure: Consumption Spending) At point A in the graph provided 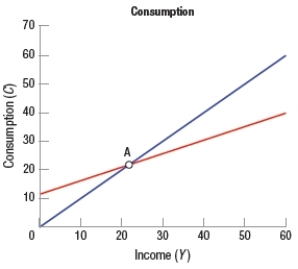
A) saving is $20.
B) consumption is zero.
C) saving is zero.
D) consumption exceeds income by $20.
Correct Answer:

Verified
Correct Answer:
Verified
Related Questions
Q248: Investment is defined as spending by<br>A) investors
Q249: One implication of a straight-line aggregate expenditures
Q250: (Table) The table that follows shows the
Q251: What are injections and withdrawals in the
Q252: From 2008 to 2009, the falling stock
Q254: As income increases, consumption<br>A) increases at a
Q255: If the marginal propensity to consume is
Q256: In the full aggregate expenditures model with
Q257: When taxes are reduced, disposable income _
Q258: If aggregate expenditures are less than current