Multiple Choice
TABLE 12-2
An agronomist wants to compare the crop yield of 3 varieties of chickpea seeds. She plants all 3 varieties of the seeds on each of 5 different patches of fields. She then measures the crop yield in bushels per acre. Treating this as a randomized block design, the results are presented in the table that follows. 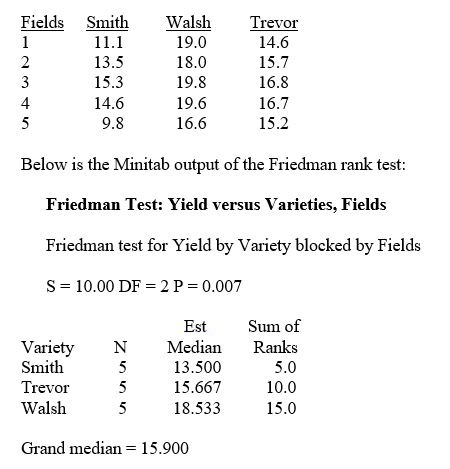
-Referring to Table 12-2, the null hypothesis for the Friedman rank test is
A) H₀: μFᵢₑld₁ = μFᵢₑld₂ = μFᵢₑld₃ = μFᵢₑld₄ = μFᵢₑld₅.
B) H₀: μSmᵢth = μWₐlsh = μTᵣₑᵥₒᵣ.
C) H₀: MFᵢₑld₁ = MFᵢₑld₂ = MFᵢₑld₃ = MFᵢₑld₄ = MFᵢₑld₅.
D) H₀: MSmᵢth = MWₐlsh = MTᵣₑᵥₒᵣ.
Correct Answer:

Verified
Correct Answer:
Verified
Q30: The risk- _ curve shows a rapid
Q74: TABLE 16-1<br>Given below are the average prices
Q75: In an Analysis of Proportions (ANOP) with
Q76: TABLE 19-6<br>A student wanted to find out
Q77: TABLE 19-1<br>The following payoff table shows profits
Q79: To test the effectiveness of a business
Q81: When the normality assumption is not met
Q83: TABLE 12-1<br>A perfume manufacturer is trying to
Q101: A tabular presentation that shows the outcome
Q198: A researcher is curious about the effect