Multiple Choice
(Figure: Understanding Surplus and Efficiency) In the graph, what is the efficient level of output? 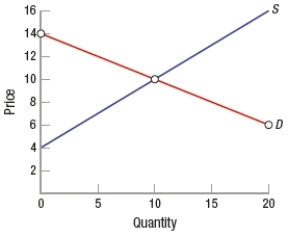
A) 0
B) 5
C) 10
D) 14
Correct Answer:

Verified
Correct Answer:
Verified
Related Questions
Q44: (Figure: Determining Total Surplus) In the graph,
Q45: Which of these would NOT yield an
Q46: (Figure: Determining Surplus 3) In the graph,
Q47: (Figure: Understanding Price Ceilings and Floors) In
Q48: External costs increase deadweight loss, while external
Q50: (Figure: Determining Surplus 3) In the graph,
Q51: According to economic theory, adequate information is
Q52: Markets tend to produce<br>A) too much of
Q53: Suppose that a major hurricane hits Florida,
Q54: Suppose that a customer's willingness-to-pay for a