Multiple Choice
(Figure: Interpreting Surplus) In the supply/demand graph 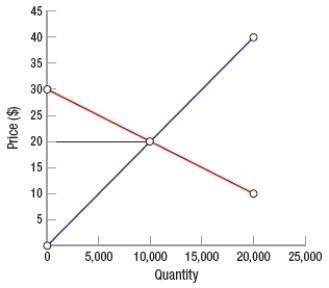
A) consumer surplus is $50,000 and producer surplus is $100,000.
B) total market surplus is $200,000.
C) total market surplus is $50,000.
D) consumer surplus is larger than producer surplus.
Correct Answer:

Verified
Correct Answer:
Verified
Q239: (Figure: Understanding Price Ceilings and Floors) In
Q240: Total surplus is the sum of consumer
Q241: (Figure: Determining Surplus and Loss) In the
Q242: Merchants' raising prices of necessary goods during
Q243: Suppose an effective price ceiling is imposed
Q245: Before a house is sold, the buyer
Q246: (Figure: Market in Equilibrium) In the market
Q247: A price floor is binding if it
Q248: (Figure: Understanding Surplus and Efficiency) In the
Q249: Suppose that a customer's willingness-to-pay for a