Multiple Choice
(Figure: Determining Surplus 6) Using the graph, we can calculate the maximum possible consumer surplus as 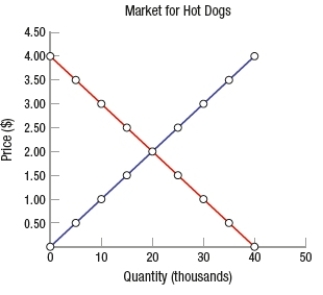
A) $10,000.
B) $20,000.
C) $40,000.
D) $80,000.
Correct Answer:

Verified
Correct Answer:
Verified
Related Questions
Q291: (Figure: Determining Surplus) In the graph, the
Q292: A price ceiling is effective if it
Q293: The difference between what the market would
Q294: (Figure: Determining Surplus and Loss) In the
Q295: (Figure: Determining Surplus) In the graph, which
Q297: (Figure: Determining Surplus) In the graph, which
Q298: The measure of society's benefits due to
Q299: (Figure: Determining Surplus 4) In the graph,
Q300: Consider the market for new homes. Ceteris
Q301: Suppose that a customer's willingness-to-pay for a