Multiple Choice
(Figure: Determining Surplus and Loss) In the graph, producer surplus is _____ in equilibrium and _____ at a price of $12. 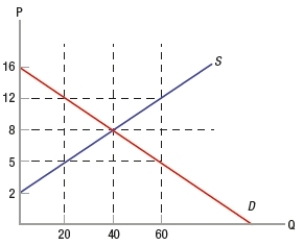
A) $0; $210
B) $160; $40
C) $120; $170
D) $120; $210
Correct Answer:

Verified
Correct Answer:
Verified
Related Questions
Q5: (Figure: Determining Surplus 6) According to the
Q6: Consider the market for new homes. Ceteris
Q7: If a consumer is willing to pay
Q8: The government often provides funding for the
Q9: Which of these would create an external
Q11: Explain how a price control, such as
Q12: Producer surplus is the area<br>A) above the
Q13: Suppose the equilibrium price for a gallon
Q14: Total surplus is calculated as<br>A) consumer surplus
Q15: Consumer surplus is the difference between the