True/False
(Figure: Determining Surplus 2) In the graph, producer surplus is $15. 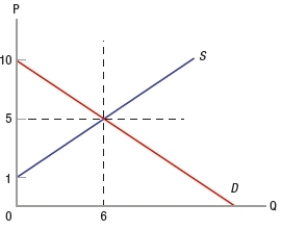
Correct Answer:

Verified
Correct Answer:
Verified
Related Questions
Q89: (Figure: Determining Surplus 3) In the graph,
Q90: Asymmetric information reduces deadweight loss.
Q91: Suppose that a customer's willingness-to-pay for a
Q92: A price ceiling usually results in a
Q93: Markets tend to provide too little of
Q95: (Figure: Determining Surplus and Loss) In the
Q96: In the market for leather wallets, if
Q97: (Figure: Determining Surplus) In the graph, the
Q98: The gap between the demand curve and
Q99: If a person gets a meningitis vaccination