Essay
Use the information in the following table to graph the demand curve for cupcakes and the supply curve for cupcakes. Label the area of deadweight loss on your graph if the price is set at $1.10. Also label the area of surplus transferred from sellers to buyers. 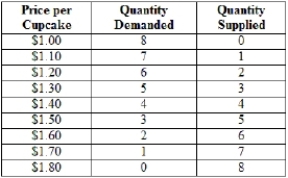
Correct Answer:

Verified
Correct Answer:
Verified
Related Questions
Q67: Which is FALSE? When the price of
Q68: Producer surplus is shown graphically as the
Q69: Which of these is the BEST example
Q70: If you are willing to sell your
Q71: Suppose that a customer's willingness-to-pay for a
Q73: Suppose the actual price for good A
Q74: (Figure: Determining Surplus 2) In the graph,
Q75: (Figure: Determining Surplus and Loss) In the
Q76: (Figure: Determining Surplus and Loss) In the
Q77: (Figure: Determining Surplus and Loss) In the