Essay
Use the information in the following table to graph the demand curve and the supply curve for cupcakes. Label the area of deadweight loss on your graph if the price is set at $1.60. Also label the area of surplus transferred from buyers to sellers. 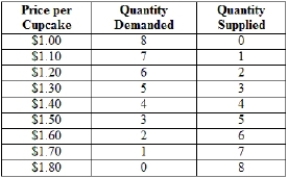
Correct Answer:

Verified
 compared to the equilibrium price, a pr...
View Answer
Unlock this answer now
Get Access to more Verified Answers free of charge
Correct Answer:
Verified
View Answer
Unlock this answer now
Get Access to more Verified Answers free of charge
Q41: If a price ceiling is set below
Q247: A price floor is binding if it
Q248: (Figure: Understanding Surplus and Efficiency) In the
Q249: Suppose that a customer's willingness-to-pay for a
Q250: Suppose the equilibrium price of carrots is
Q251: Which is one of the four major
Q253: Laws used to keep market prices from
Q254: (Figure: Determining Surplus 4) In the graph,
Q256: (Figure: Determining Surplus) In the graph, what
Q257: A price ceiling is a _ which