Essay
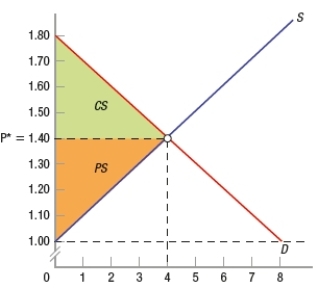
Use the information in the table to graph the demand curve and the supply curve for cupcakes. Label consumer surplus (CS) and producer surplus (PS). Calculate how much consumer surplus there is in this market and how much producer surplus there is in this market. 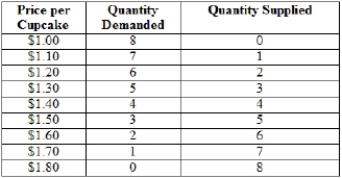
Correct Answer:

Verified
Consumer surplus = [($1.80 - $1.40) × 4]...View Answer
Unlock this answer now
Get Access to more Verified Answers free of charge
Correct Answer:
Verified
View Answer
Unlock this answer now
Get Access to more Verified Answers free of charge
Q11: Explain how a price control, such as
Q12: Producer surplus is the area<br>A) above the
Q13: Suppose the equilibrium price for a gallon
Q14: Total surplus is calculated as<br>A) consumer surplus
Q15: Consumer surplus is the difference between the
Q17: Laissez-faire is a French term that means
Q18: Suppose that a customer's willingness-to-pay for a
Q19: (Figure: Understanding Surplus and Efficiency) In the
Q20: A good example of a government-imposed price
Q21: The difference between the market price and