Multiple Choice
(Figure: Interpreting a Market Graph) The graph represents 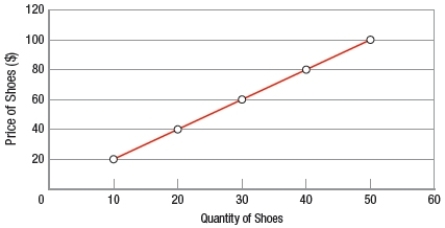
A) willingness-to-pay.
B) the price system.
C) the law of supply.
D) the law of demand.
Correct Answer:

Verified
Correct Answer:
Verified
Related Questions
Q226: Willingness-to-pay is the maximum amount one would
Q227: Whenever you construct a demand curve, which
Q228: When economists refer to a market demand
Q229: Willingness-to-pay differs from person to person but
Q230: (Table) Using the data in the table
Q232: Which scenario is the MOST likely effect
Q233: An increase in demand causes the equilibrium
Q234: Which item is most likely an inferior
Q235: Which scenario is the MOST likely effect
Q236: Markets work as if they are<br>A) guided