Multiple Choice
Which graph shows an increase in quantity supplied?
A) 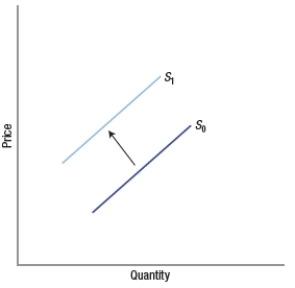
B) 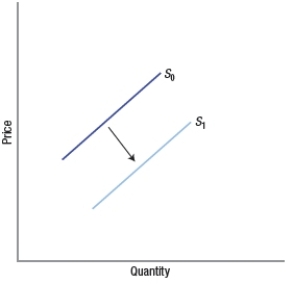
C) 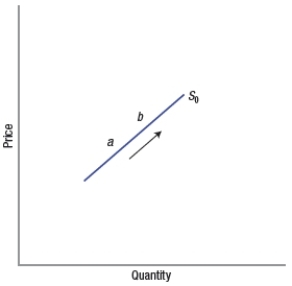
D) 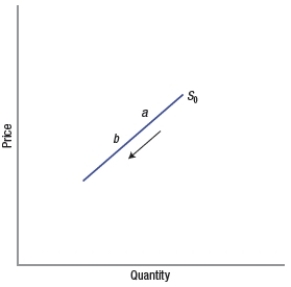
Correct Answer:

Verified
Correct Answer:
Verified
Related Questions
Q134: Assume that butter is a substitute for
Q135: The law of supply states that if
Q136: Supply is the maximum amount of a
Q137: When the supply of coffee decreases<br>A) there
Q138: Prices typically contain more useful information for
Q140: What factor changes would cause an increase
Q141: The price of apples has recently fallen
Q142: In the market for electric vehicles (EVs),
Q143: If both the supply of and the
Q144: As the price of orange juice rises,