Multiple Choice
(Figure: Ships and Autos in Countries A and B) Two countries manufacture autos and ships. Based on the graphs, which statement is correct? 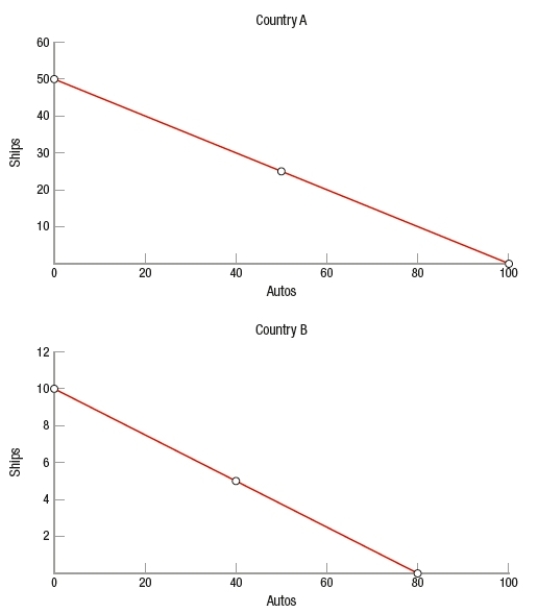
A) The opportunity cost in country A of producing 1 ship is 2 cars.
B) The opportunity cost in country B of producing 1 ship is 10 cars.
C) Country B is more efficient in the production of ships.
D) Both countries are equally efficient in the production of ships because the PPFs are linear.
Correct Answer:

Verified
Correct Answer:
Verified
Q67: The way an economy allocates output to
Q68: In a _ economy, individuals and firms
Q69: Free trade is known as a _
Q70: _ is one of China's top five
Q71: (Figure: PPF of Econia (a small nation))
Q73: Can a productively efficient economy be allocatively
Q74: One of the major limits to trade
Q75: There is no opportunity cost involved when
Q76: As it relates to the production possibilities
Q77: Economic growth is driven by<br>A) an increase