Multiple Choice
(Figure: Interpreting PFF Shifts 4) The graph depicts the effects of an improvement in technology. One can conclude from the graph that the technology 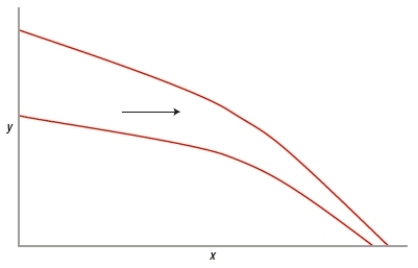
A) provided minimal benefit to this society.
B) affected the production of x more than the production of y.
C) reduced unemployment.
D) affected the production of y more than the production of x.
Correct Answer:

Verified
Correct Answer:
Verified
Q34: A country should always produce the items
Q35: Which pair does NOT relate?<br>A) capital -
Q36: The theory that suggested countries would mutually
Q37: The derivation of a production possibilities frontier
Q38: "How goods and services are advertised" is
Q40: (Figure: Corn and Oil in the United
Q41: (Figure: Determining Production Possibilities) The graph shows
Q42: The government can make owning a business
Q43: Suppose that the government could stimulate spending
Q44: Which of these would be MOST likely