Multiple Choice
(Figure: Bread and Honey) Which point in the graph represents unemployed resources? 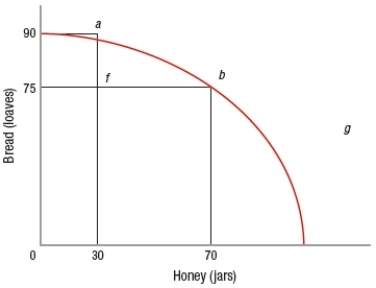
A) a
B) b
C) f
D) g
Correct Answer:

Verified
Correct Answer:
Verified
Related Questions
Q288: In an eight-hour day, Isabel can produce
Q289: (Figure: Biscuit and Cookies PPFs) Greg and
Q290: If an economy is operating at a
Q291: Which is NOT a source of economic
Q292: A production possibilities frontier with increasing opportunity
Q294: Suppose the country of Alphaland can produce
Q295: Much of the economic growth we have
Q296: Economic growth is<br>A) unaffected by increases in
Q297: (Figure: Pork and Corn PPF) Economists can
Q298: A laissez-faire approach to the question "How