Multiple Choice
(Figure: Bread and Honey) In the graph, a move from point a to point b costs 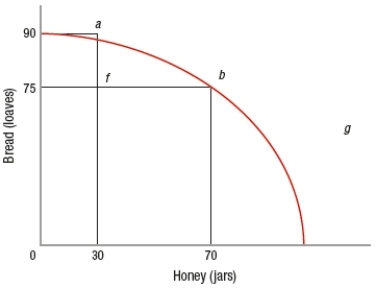
A) 70 jars of honey.
B) 75 loaves of bread.
C) 90 loaves of bread.
D) 15 loaves of bread.
Correct Answer:

Verified
Correct Answer:
Verified
Related Questions
Q334: Which statement BEST illustrates increasing opportunity costs?<br>A)
Q335: A curve of which shape reflects the
Q336: Capital<br>A) refers to commercial bank-lending policies.<br>B) is
Q337: If a nation selects a product mix
Q338: When an economy is operating efficiently, the
Q340: Comparative advantage stems from differences in the
Q341: (Figure: Bread and Honey) In the graph,
Q342: The concept of human capital is important
Q343: If an economy is producing at a
Q344: A country operating outside of the production