Essay
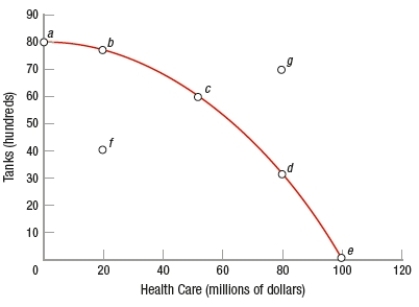
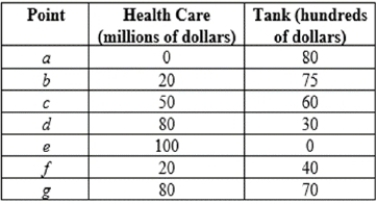
(Figure: Tanks and Health Care) Refer to the graph and table and calculate the opportunity costs of moving from points a to b, b to c, and c to
d.
Correct Answer:

Verified
Moving from a to b results in giving up ...View Answer
Unlock this answer now
Get Access to more Verified Answers free of charge
Correct Answer:
Verified
View Answer
Unlock this answer now
Get Access to more Verified Answers free of charge
Q327: Another term for "market economy" is "capitalist
Q328: Explain how a free-market economy decides what
Q329: Employing resources that are not as well
Q330: The production possibilities frontier shows the combinations
Q331: (Table) The table shows coffee and tea
Q333: When the mix of goods and services
Q334: Which statement BEST illustrates increasing opportunity costs?<br>A)
Q335: A curve of which shape reflects the
Q336: Capital<br>A) refers to commercial bank-lending policies.<br>B) is
Q337: If a nation selects a product mix