Essay
The table below shows data for the widget market. Graph the supply and demand curves. Suppose the world price of widgets is $100 and there is free trade. What would happen to the price for widgets if the government imposes a quota of 30 units? 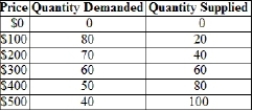
Correct Answer:

Verified
The graph is shown below. The domestic e...View Answer
Unlock this answer now
Get Access to more Verified Answers free of charge
Correct Answer:
Verified
View Answer
Unlock this answer now
Get Access to more Verified Answers free of charge
Q185: "A tariff should be imposed on Chinese
Q186: Both Germany and India produce gadgets. Germany
Q187: (Figure: Gadgets and Widgets) According to the
Q188: Over the last several decades, U.S. tariffs
Q189: (Table) Referring to the table, assume that
Q191: Trade restrictions occur because the benefits of
Q192: The United States exports more consumer goods
Q193: From a macroeconomic perspective, consumers benefit from
Q194: Theoretically, does the outsourcing of labor to
Q195: Infant industries are given a government's protection