Multiple Choice
(Figure: Determining Curves) The curve in the graph represents a _____ curve. 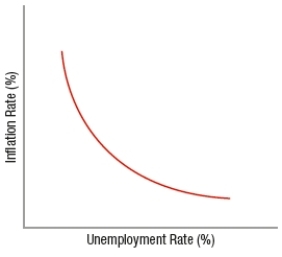
A) demand
B) Phillips
C) labor demand
D) production possibilities
Correct Answer:

Verified
Correct Answer:
Verified
Related Questions
Q97: The American Recovery and Reinvestment Act, signed
Q98: Economic expectations formed after individuals make the
Q99: Describe how inflationary expectations can take on
Q100: (Figure: Determining Long-Run and Short-Run Economic Shifts)
Q101: Assume that nominal wages increase 10% and
Q103: In a global economy, a problem with
Q104: The contribution of the rational expectations theory
Q105: According to the equation for the Phillips
Q106: The Federal Reserve will most likely halt
Q107: Using the equation for the Phillips curve,