Multiple Choice
(Figure: Market for Loanable Funds) The graph shows the supply and demand for loanable funds. If the market interest rate is 3% 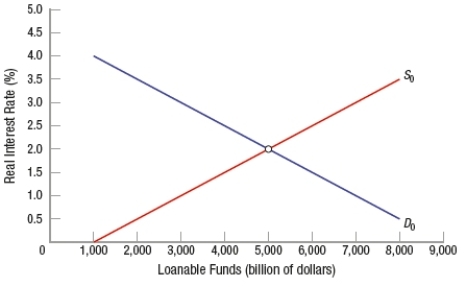
A) the market will reach equilibrium only if lenders decide to save more.
B) more funds will be demanded by firms than supplied by households.
C) there will be pressure for the interest rate to rise.
D) there will be an excess supply of funds.
Correct Answer:

Verified
Correct Answer:
Verified
Q183: The direct exchange of goods and services
Q184: Who is responsible for paying off a
Q185: The supply curve for loanable funds represents
Q186: If the government issues receipts for goods
Q187: What is the likely chain of events
Q189: Which of these is NOT a primary
Q190: Checking accounts are counted as part of<br>A)
Q191: Suppose a perpetuity bond with a face
Q192: When a perpetual bond with a face
Q193: _ are a higher-risk investment than _