Multiple Choice
Which graph BEST depicts the impact of a policy that reduces burdensome regulations?
A) 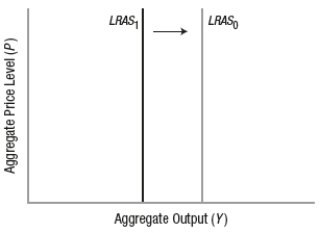
B) 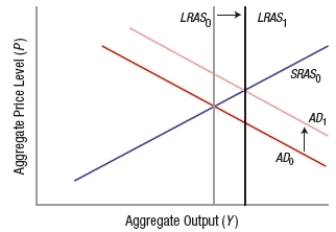
C) 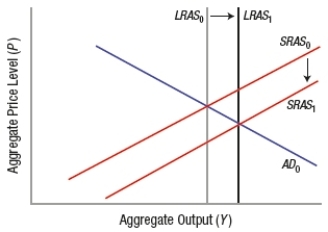
D) 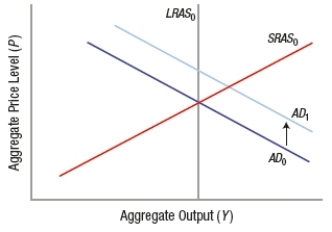
Correct Answer:

Verified
Correct Answer:
Verified
Related Questions
Q136: Interest on the national debt is an
Q137: Describe the instruments that make up the
Q138: Which of these will increase aggregate supply?<br>A)
Q139: Which of these is NOT a fiscal
Q140: A problem with supply-side fiscal policies is
Q142: GDP equals investment plus savings.
Q143: According to public choice economists, deficit spending<br>A)
Q144: _ are U.S. Treasury securities considered to
Q145: When government spending increases, the aggregate demand
Q146: One characteristic of an annually balanced federal