Multiple Choice
(Figure: Understanding SRAS and LRAS Shifts) This graph shows _____ policies. 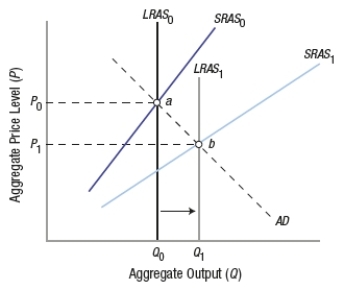
A) demand-side fiscal
B) supply-side fiscal
C) a combination of supply-side and demand-side fiscal
D) demand-side monetary
Correct Answer:

Verified
Correct Answer:
Verified
Q356: Discretionary spending as a percentage of the
Q357: Which policy do supply-side economists believe is
Q358: The fact that automatic stabilizers work without
Q359: Public debt owned by U.S. banks, corporations,
Q360: Expansionary demand-side fiscal policies set up a
Q361: When the economy is at full employment,
Q362: The federal government can finance its debt
Q364: Low interest rates are primarily responsible for
Q365: In the United States, the president, the
Q366: The crowding-out effect<br>A) replaces some private investment