Multiple Choice
(Figure: Laffer Curve) The graph shows a hypothetical Laffer curve. If the tax rate is 80%, the 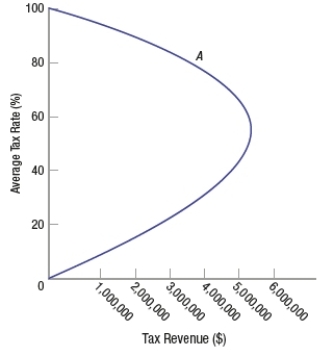
A) government should reduce the rate to 50% to maximize tax revenue.
B) tax rate should be increased to 100% to maximize tax revenues.
C) tax rate is at its optimal level.
D) tax rate should be reduced to zero to maximize tax revenue.
Correct Answer:

Verified
Correct Answer:
Verified
Q296: Suppose the economy is growing at 4%
Q297: The largest source of federal government revenues
Q298: What type of government spending would be
Q299: Supply-side fiscal policies include all of these
Q300: If an expansionary policy pushes output beyond
Q302: The lags associated with spending changes are
Q303: The cyclically balanced budget<br>A) is not easy
Q304: Transfer payments are<br>A) monies paid directly to
Q305: The Federal Reserve can purchase _ to
Q306: Which of these is specifically designed to