Multiple Choice
(Figure: Laffer Curve 2) The figure shows the Laffer curve for an economy whose tax rate is 80%. Supply-side economists would argue that the government should 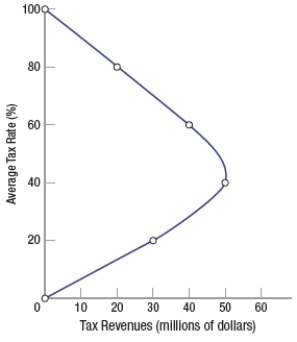
A) reduce the tax rate to 40%.
B) reduce the tax rate to 20%.
C) keep the tax rate at 80%.
D) reduce the tax rate to 60%.
Correct Answer:

Verified
Correct Answer:
Verified
Q285: The solution to simultaneous deflation and unemployment
Q286: Crowding out<br>A) refers to government spending crowding
Q287: What are some of the tools supply-side
Q288: Over the past few decades, external debt
Q289: Which of these illustrates the information lag?<br>A)
Q291: If a government collects $1,400 in tax
Q292: How can public investment mitigate the crowding-out
Q293: What is the main reason that economists
Q294: Suppose a country has full employment and
Q295: Suppose the government increases aggregate demand to