Multiple Choice
(Figure: Crop Yield and Fertilizer) The graph shows a hypothetical relationship between tons of fertilizer used and crop yields. Which statement is NOT correct? 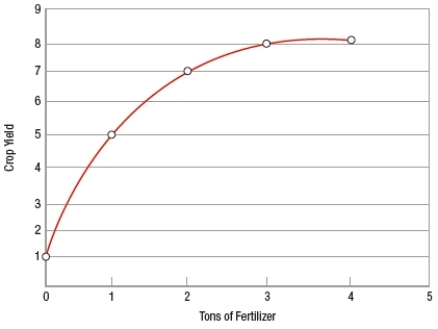
A) The slope of the curve between 1 and 2 tons of fertilizer is approximately 2.
B) The relationship between fertilizer usage and yield is nonlinear.
C) Because the relationship is nonlinear, it is difficult to create an economic model describing the relationship between the two variables.
D) Using more than 3 tons of fertilizer has minimal effect on yield.
Correct Answer:

Verified
Correct Answer:
Verified
Q291: Discuss the difference between efficiency and equity.
Q292: Titles, labels for axes, and a statement
Q293: There would be no economic problems in
Q294: Rational behavior requires thinking at the margin.
Q295: Scarcity is not a problem faced by
Q297: What drives and disciplines markets?<br>A) equity<br>B) prices
Q298: Examining whether the country's price level has
Q299: If a graph showed that as the
Q300: Paying a salesperson more for increased sales
Q301: The height of the bars in a