Multiple Choice
(Figure: Education and Earnings) The data in the graph show the relationship between years of education and salary. Which statement is NOT correct? 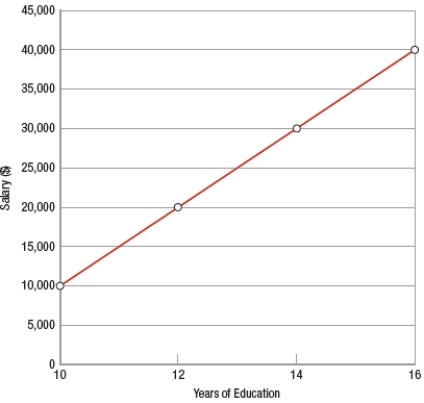
A) A person with 13 years of education can expect to earn $25,000.
B) The slope of the line is 5,000.
C) The line represents a simple model of the relationship between education and earnings.
D) The relationship between the two variables is nonlinear.
Correct Answer:

Verified
Correct Answer:
Verified
Q73: The extra cost associated with undertaking some
Q74: Rational behavior<br>A) means incentives don't matter.<br>B) requires
Q75: John, a farmer, thinks he will make
Q76: Scarcity<br>A) is synonymous with poverty.<br>B) is eliminated
Q77: For a nation, _ productivity growth leads
Q79: Suppose an economist discovers that the relationship
Q80: (Figure: Mileage and Speed by Car Weight)
Q81: Marginal analysis is defined as when a
Q82: A strong monetary system is an example
Q83: (Table) Assume the relationship between temperature (T)