True/False
(Figure: Sales and Advertising) The graph shows the advertising expenditures and the resulting sales (in bottles) of a new caffeinated beverage called Jump. The slope for the equation graphed is 3,000. 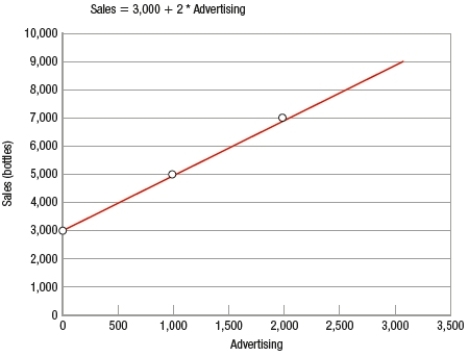
Correct Answer:

Verified
Correct Answer:
Verified
Related Questions
Q312: Thinking at the margin involves<br>A) influencing how
Q313: In the equation S = 130 -
Q314: Resources are<br>A) unlimited, but wants are limited.<br>B)
Q315: (Figure: Sales and Advertising) The graph shows
Q316: "Scarcity" is best defined as when the
Q318: An example of a microeconomic question would
Q319: There is general agreement as to which
Q320: Which statement regarding macroeconomics and microeconomics is
Q321: People use _ to determine how many
Q322: Pie charts<br>A) depict two variables to see