Multiple Choice
(Table) If the numbers in the table were placed on a graph, with hot chocolate sales on the vertical axis and temperature on the horizontal axis, a 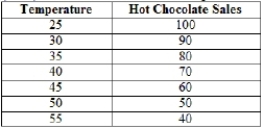
A) positive, nonlinear curve would result.
B) negative, linear relationship between temperature and hot chocolate sales would be shown.
C) positive, linear relationship between temperature and hot chocolate sales would be shown.
D) negative, nonlinear curve would result.
Correct Answer:

Verified
Correct Answer:
Verified
Q186: (Figure: Graph Examples) Which graph is an
Q187: Microeconomics looks at how markets are structured.
Q188: Linear relationships show the same slope between
Q189: Information plays an important role in the
Q190: Economics is a social science that involves
Q192: One of the key ingredients in making
Q193: The ceteris paribus assumption holds some variables
Q194: The main difference between macroeconomics and microeconomics
Q195: Which statement does NOT involve thinking at
Q196: The _ of parking at school includes