Multiple Choice
(Figure: Graph Interpretation) In the graph, the equation for the line is 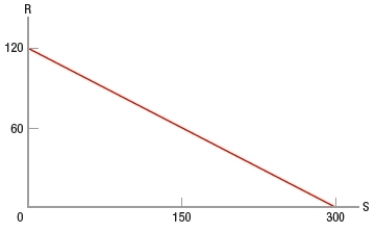
A) R = 120 - 0.4S.
B) R = 120 - 300S.
C) R = 120 + 0.4S.
D) R = 300 + 120S.
Correct Answer:

Verified
Correct Answer:
Verified
Related Questions
Q126: Which paired variables might indicate a correlation
Q127: The study of economics<br>A) primarily considers the
Q128: Which statement is an example of a
Q129: At the start of the war in
Q130: Which topic is MOST likely to be
Q132: If a restaurant that traditionally has served
Q133: What is the opportunity cost of taking
Q134: Opportunity costs exist because<br>A) using resources for
Q135: Microeconomics looks at particular markets within an
Q136: Which statement is a characteristic of economic