Multiple Choice
(Figure: Weight Loss and Exercise Time) According to the data in the graph, where weight loss is shown on the y axis, every two extra hours of exercise 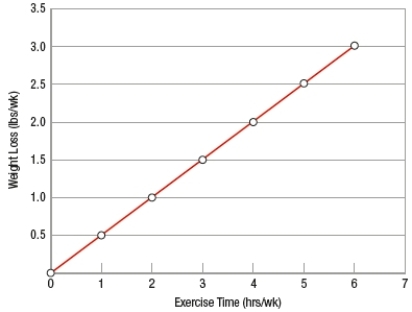
A) decreases weight by ½ a pound.
B) increases weight by ½ a pound.
C) decreases weight by 1 pound.
D) increases weight by 1 pound.
Correct Answer:

Verified
Correct Answer:
Verified
Q282: Setting government policy to achieve economic goals
Q283: Time series graphs include the value of
Q284: Which would BEST represent a positive statement?<br>A)
Q285: The decisions made by individuals and firms
Q286: When countries specialize in producing a particular
Q288: The answers to normative questions<br>A) are the
Q289: Evaluate the following statement: To be useful,
Q290: Macroeconomics focuses on<br>A) decisions made by individuals.<br>B)
Q291: Discuss the difference between efficiency and equity.
Q292: Titles, labels for axes, and a statement