Multiple Choice
The scatter diagram below shows the record times for races of different lengths at a junior high school track meet, where x is the length of the race in meters and y is the time of race in seconds. Suppose the school adds a 500-meter race. How will that change the scatter plot? Will the graph have the same number of points or an additional point? 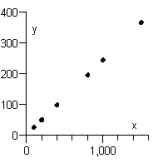
A) The point will be graphed with an x-coordinate of 500 and a y-coordinate equal to the record time for the 500-meter race. The graph will not have an additional point.
B) The point will be graphed with an x-coordinate of 500 and a y-coordinate equal to the record time for the 500-meter race. The graph will have an additional point.
C) The point will be graphed with an x-coordinate equal to the record time for the 500-meter race and a y-coordinate of 500. The graph will have an additional point.
D) The point will be graphed with an x-coordinate equal to the record time for the 500-meter race and a y-coordinate of 500. The graph will not have an additional point.
E) The point will be graphed with an x-coordinate of 500 and a y-coordinate of 500. The graph will not have an additional point.
Correct Answer:

Verified
Correct Answer:
Verified
Q26: Find the equation of the line that
Q27: Is the line that contains the points
Q28: Find the equation of the line passing
Q29: State whether the following relation is a
Q30: Graph the solution set of the inequality
Q32: Graph by using the slope and y-intercept:
Q33: Given the function <img src="https://d2lvgg3v3hfg70.cloudfront.net/TB8311/.jpg" alt="Given the
Q34: Find the equation of the line that
Q35: Let f be a linear function. If
Q36: Graph: <img src="https://d2lvgg3v3hfg70.cloudfront.net/TB8311/.jpg" alt="Graph: A)