Multiple Choice
Does the diagram below represent a function? 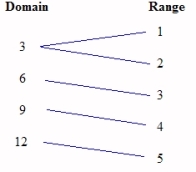
A) Insufficient information
B) Yes
C) No
Correct Answer:

Verified
Correct Answer:
Verified
Related Questions
Q65: Graph: <img src="https://d2lvgg3v3hfg70.cloudfront.net/TB8311/.jpg" alt="Graph:
Q66: What values are excluded from the domain
Q67: Graph the solution set of the inequality
Q68: State whether the following relation is a
Q69: Is the line <img src="https://d2lvgg3v3hfg70.cloudfront.net/TB8311/.jpg" alt="Is the
Q71: The graph below shows the relationship between
Q72: Find the equation of the line that
Q73: Graph by using the slope and y-intercept:
Q74: Find the equation of the line containing
Q75: Graph by using the slope and y-intercept: