Multiple Choice
The graph below shows how the amount of fuel in the tank of a car decreases as the car is driven. Find the slope of the line between the two points shown on the graph, namely (50, 15) and (150, 9) . Write a sentence that states the meaning of the slope. 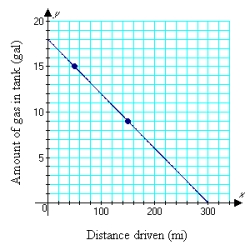
A) m = -0.06; For each 100 miles the car is driven, approximately 0.06 gal of fuel is used.
B) m = -0.06; For each mile the car is driven, approximately 0.06 gal of fuel is used.
C) m = -0.06; The car averages approximately 60 miles per gallon.
D) m = 0.06; For each mile the car is driven, approximately 0.06 gal of fuel is used.
E) m = -0.6; For each mile the car is driven, approximately 0.6 gal of fuel is used.
Correct Answer:

Verified
Correct Answer:
Verified
Q1: Given <img src="https://d2lvgg3v3hfg70.cloudfront.net/TB8311/.jpg" alt="Given ,
Q2: Find the equation of line that contains
Q3: The graph below shows the relationship between
Q4: Graph: <img src="https://d2lvgg3v3hfg70.cloudfront.net/TB8311/.jpg" alt="Graph: A)
Q5: A cellular phone company offers several different
Q7: What values are excluded from the domain
Q8: What values are excluded from the domain
Q9: Is (-2, -10) a solution of <img
Q10: The scatter diagram below pairs numbers of
Q11: Name the abscissa of the point below.