Multiple Choice
 Assume the market depicted in the graph is in equilibrium. Consumer surplus is the area:
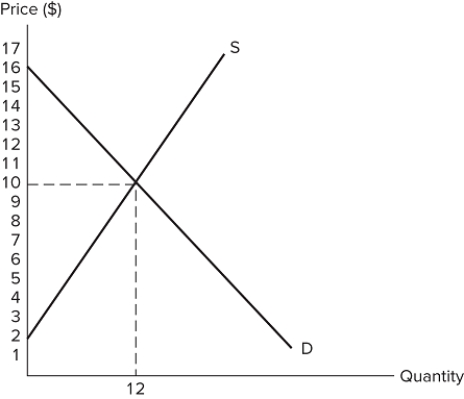
A) under the supply curve and above the market price.
B) above the supply curve and below the market price.
C) under the demand curve and above the market price.
D) above the demand curve and below the market price.
Correct Answer:

Verified
Correct Answer:
Verified
Q14: A market has four individuals, each considering
Q15: When a perfectly competitive, well-functioning market is
Q16: A market has four individuals, each considering
Q17: Assume there are three hardware stores, each
Q18: <img src="https://d2lvgg3v3hfg70.cloudfront.net/TB8194/.jpg" alt=" Assume the market
Q20: <img src="https://d2lvgg3v3hfg70.cloudfront.net/TB8194/.jpg" alt=" Assume the market
Q21: The maximum price that a buyer would
Q22: Suppose Sam's opportunity cost of producing a
Q23: Assume a market price is set artificially
Q24: Assume a market has an equilibrium price